 Monolith Analytics
Winning Omaha by more
Omaha couldn’t have won the race for Osborn on its own; no single place could. But it was the biggest piece of a statewide shortfall.
A reader replied to my post on the missing Democratic vote with a fair question. Osborn won Omaha by 20 points. What did Ben Nelson and Kerrey win Omaha by? “Need to win Omaha” is fine, and Osborn did. So what’s the problem?
First, a correction to my own framing. My earlier post could be read as saying Omaha could have won this race. It couldn’t have, not by itself. Even if Omaha had matched Harris’s 2024 vote exactly, Osborn still loses by about 19,600 votes.
Here’s the argument I should have made. A working-class majority in Nebraska needs two things at once: rural and small-town voters willing to cross over, and the Democratic vote in the cities coming out at something like a presidential-year rate. Osborn’s campaign delivered most of the first. The second fell short everywhere, Omaha most of all, and inside Omaha it fell furthest in the poorest precincts. Getting those voters out in a midterm takes an organization knocking doors for months, the way the 2024 presidential campaigns did. I can’t find anything on that scale in 2026, and the results look like there wasn’t one. The race may never have been winnable. But the margin made it look like Omaha had done its part, and it hadn’t.
Throughout, “Omaha” means Douglas County unless Sarpy is named too. The 2026 figures are the county count as of 7 November.
What Nelson and Kerrey won Omaha by
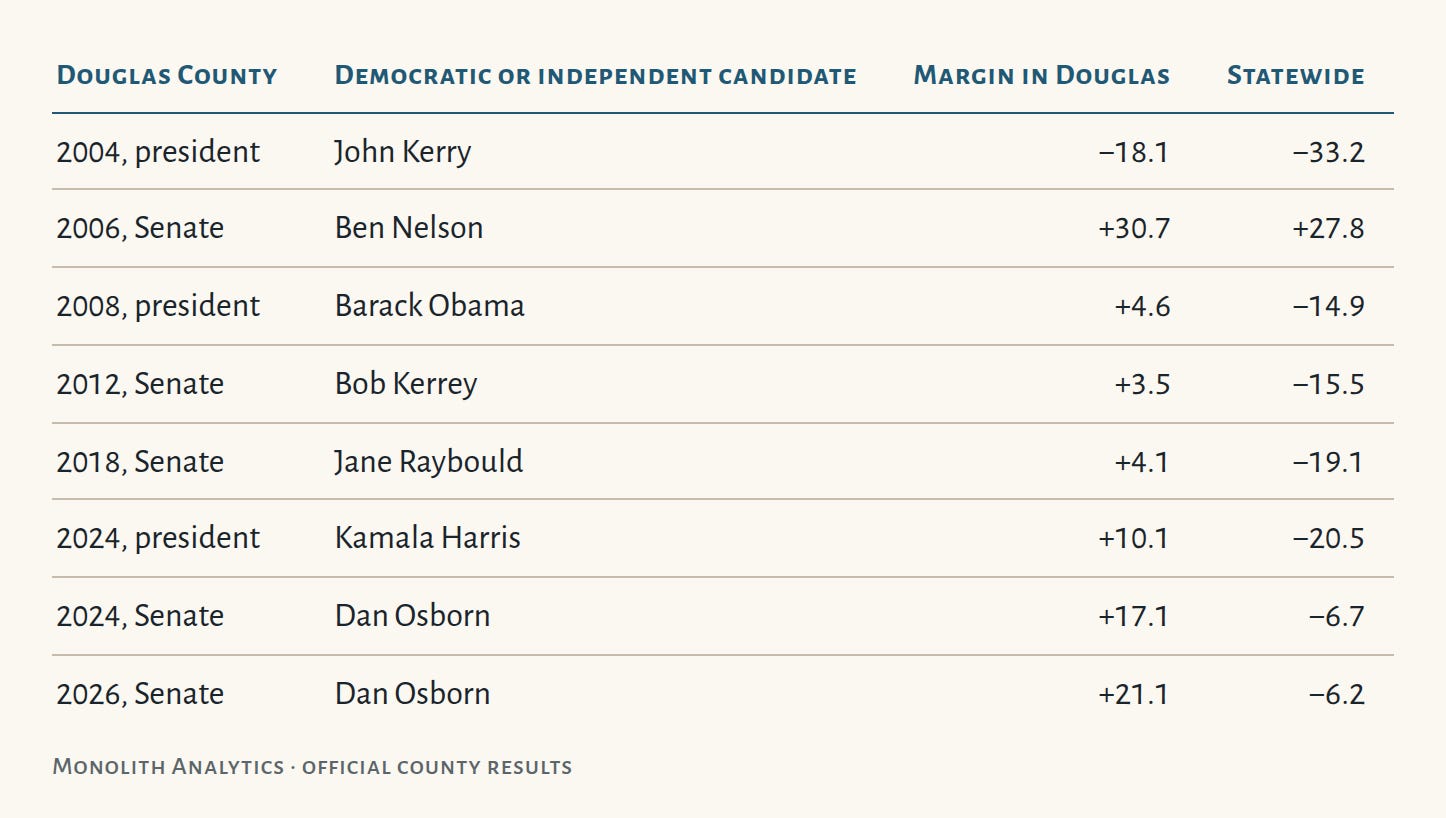
Margins are shares of all votes cast in the race. Kerrey won Omaha and lost the state by 16 points. Nelson won it by 31, against the same Pete Ricketts, and won the state by 28.
Nelson’s case is the instructive one. By the official canvass (some sites still show the election-night count, which is a little lower), his net votes out of Douglas were 44,908; Osborn’s this year were 46,198, almost exactly the same. The difference was everything outside Douglas: Nelson won it by about 120,000 votes, and Osborn lost it by about 93,000. That Nebraska, where rural Republicans split their tickets for a Democrat in large numbers, hasn’t shown up in a Senate race since. So in none of these races did Omaha decide the outcome on its own. What it can decide, in a close one, is how many votes it adds.
Same net votes, fewer voters
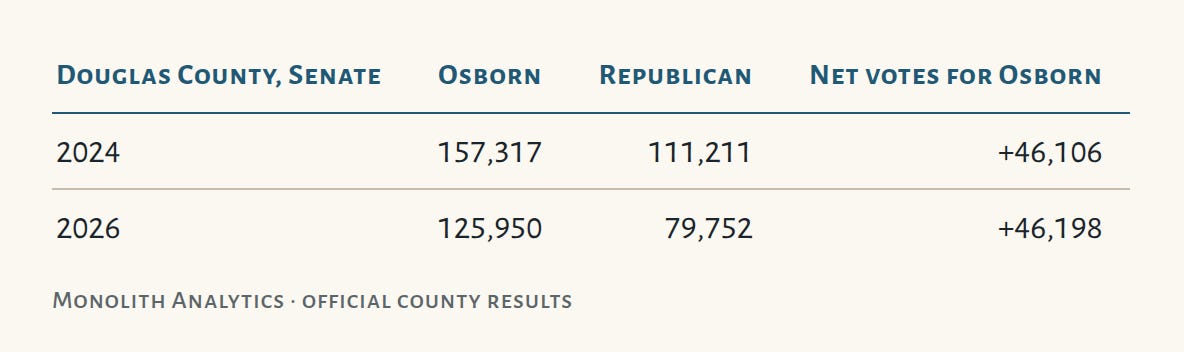
Douglas gave Osborn the same 46,000 net votes both years. (On the latest count Douglas’s 2026 net is 46,787, still within 700 of 2024’s.) The margin widened from 17 points to 21 only because the Republican vote fell 28% and Osborn’s fell 20%. Net votes are what count statewide, and on net votes the wider margin bought nothing.
The test: holding Harris’s vote
Everywhere in Nebraska, the Republican side kept about two-thirds of Trump’s 2024 vote: 66% in Douglas, 64% in Sarpy, 65% in Lancaster, 68% in the rest of the state. With the Republican drop that even, the question is how much of Harris’s vote each place brought back.
The statewide arithmetic is short. Ricketts got 378,244 votes, 67% of Trump’s 564,816. Harris got 369,995. To win, Osborn needed 378,245, which is 102% of Harris’s total. Osborn got 331,250, or 90%.
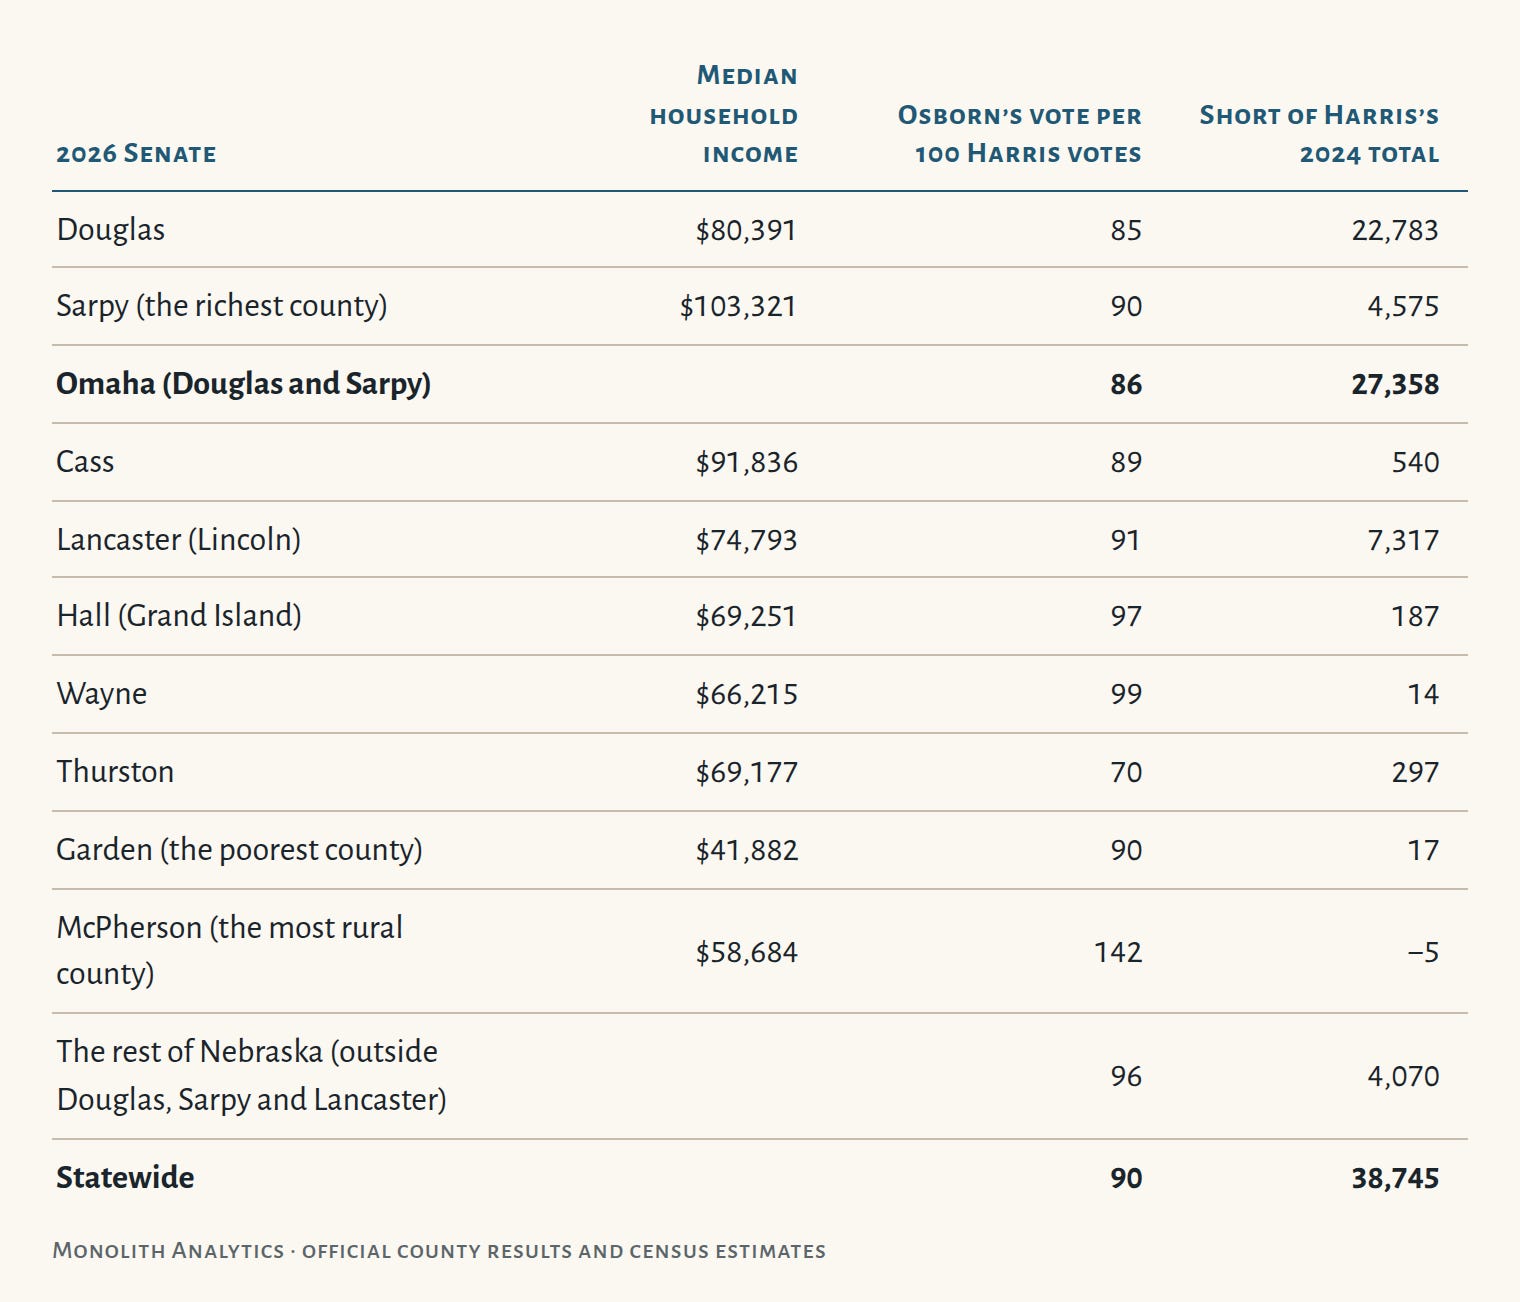
Douglas and Sarpy cast 52% of Harris’s statewide vote and accounted for 71% of the shortfall. That’s county arithmetic from public results. The rest of the state came closest to Harris’s number, because Osborn picked up Republican and independent votes there. Omaha fell furthest from it.
A few things in the county rows are worth pulling out:
The Omaha area looks like Omaha. Cass and Sarpy, two of the four richest counties in the state, held 89 and 90. Hall and Wayne, with no city near Omaha’s size, held 97 and 99.
Income doesn’t sort the counties the way it sorts Omaha’s neighborhoods. Split the 90 counties outside Douglas, Sarpy and Lancaster into thirds by median household income, and the poorest third held 97 per 100 while the richest third held 95.5. Garden, the poorest county in the state, held 90, the same as Sarpy, the richest. The vote didn’t fall furthest among poor voters in general. It fell furthest among poor voters in the city. One caution: outside the cities Osborn’s vote includes Republican and independent crossover voters, so a rural county at 97 doesn’t mean 97 of every 100 Harris voters came back. Some of that is crossover filling the gap. The same is true in Omaha, where Osborn also won some Republican and independent votes, so if anything the drop among Harris’s own voters there was larger than 85 suggests.
Thurston County is the low point. Home to the Omaha and Winnebago reservations, it held 70 per 100, the lowest of any county here, and cast 73 ballots for every 100 it cast for president. It’s a small county, 978 Harris votes in 2024, so the 297-vote shortfall matters more as a sign than as a number.
McPherson County is the crossover in miniature. It’s the most rural county in the state: about 475 people on 859 square miles, by the Census Bureau’s 2020–2024 estimate (the 2020 census counted 399). Harris got 12 votes there in 2024. Osborn got 17, more than Harris, so at least some of Osborn’s voters there hadn’t voted for Harris.
Small counties are noisy. McPherson had 12 Harris votes and Garden 162. Read the rural rows as a pattern, not as precise figures.
Omaha couldn’t have done it alone
This is where I need to be careful, because “71% of the shortfall” invites a reading I don’t mean.
If Omaha had matched Harris exactly (100 per 100), Osborn gains 27,358 votes and still loses by about 19,600.
To win on Omaha alone, Douglas and Sarpy would have needed 110 Osborn votes for every 100 Harris votes. The most Democratic counties in Kansas, Iowa, Texas and Mississippi held between 96 and 109 this year. Omaha would have had to beat the best of them.
The winning path ran through every part of the state. My earlier estimate that Osborn wins by about 2,800 votes assumes the whole state holds 103 per 100, the typical rate in those four states. Douglas and Sarpy supply about two-thirds of the votes in that scenario and the rest of the state the other third. Lincoln at 91 and the rest of Nebraska at 96 had room too.
So the honest claim is narrower than “Omaha lost it.” The race needed a statewide over-performance of the kind the redder winning states got. Omaha was the biggest place it didn’t happen, and the margin hid that.
It wasn’t a collapse. That’s the problem.
Midterms always lose voters, so it’s fair to ask whether 85 per 100 is unusual for Omaha. Here is every Douglas County midterm since 2006, against the presidential race two years before.
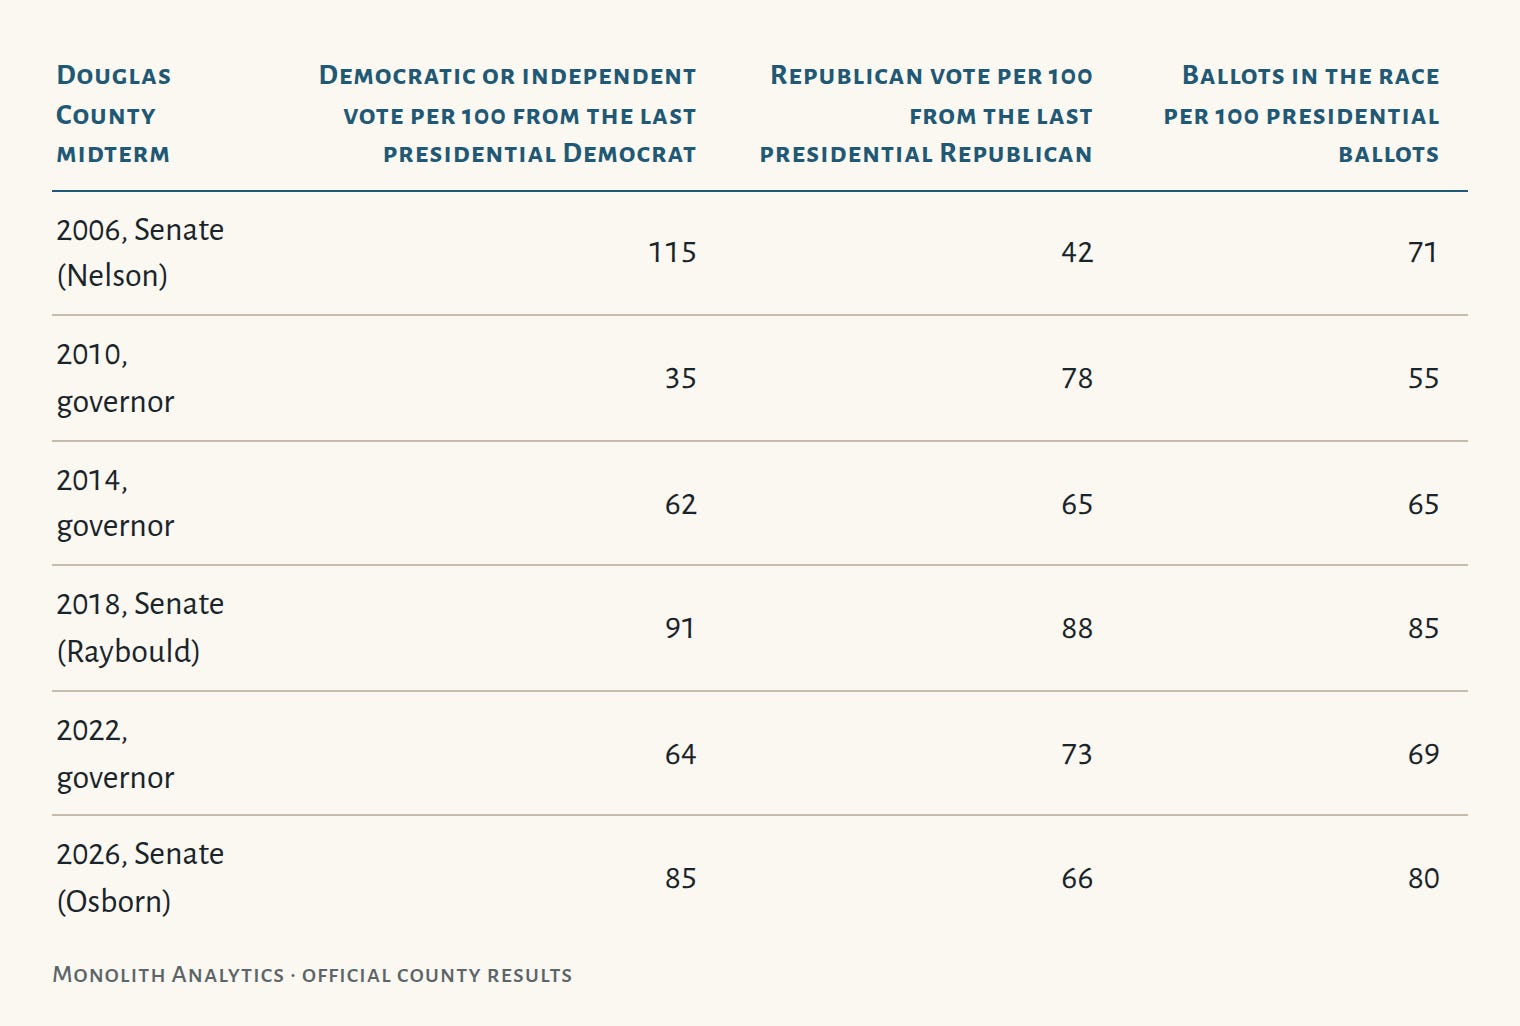
By Omaha’s own record, 2026 was a good midterm. Osborn held more of the presidential Democratic vote than anyone but Nelson and Raybould, and Douglas cast about 15% more votes than in 2022.
But a normal good midterm wasn’t what this race needed. It needed 102 per 100 statewide. Every part of Nebraska fell short of that (the rest of the state held 96, Lincoln 91), and Douglas fell furthest, at 85. Compare the red states where Democrats won this year. My earlier posts used four of them: Texas and Mississippi because they were this year’s headline wins, and Kansas and Iowa because they border Nebraska. Trump carried all four by 13 to 23 points. Their most Democratic counties didn’t have a normal midterm. They cast 86 to 93 ballots for every 100 they cast for president and held 96 to 109 Democratic votes for every 100 Harris votes. Their base came out at a higher rate than a midterm usually brings. Omaha’s came out at the usual rate.
Those four aren’t the only red states Democrats won, and two others are worth adding. South Carolina, which Trump carried by 18 points (Nebraska: 20), elected a Democratic senator who held 101 votes for every 100 Harris votes, against Osborn’s 90. Ohio cuts the other way. Its Democratic Senate candidate won while holding only 91, about Osborn’s rate, and Ohio’s most Democratic counties held 90, about Omaha’s. But Trump carried Ohio by 11, so a Nebraska-sized hold was enough there. That’s the honest version of the comparison: a state as red as Nebraska needed its base to do better than usual, and the ones that won got it.
Who stayed home
The drop inside Omaha ran through every kind of neighborhood, but it wasn’t even. Sorting Omaha’s precincts into fifths by average household income:
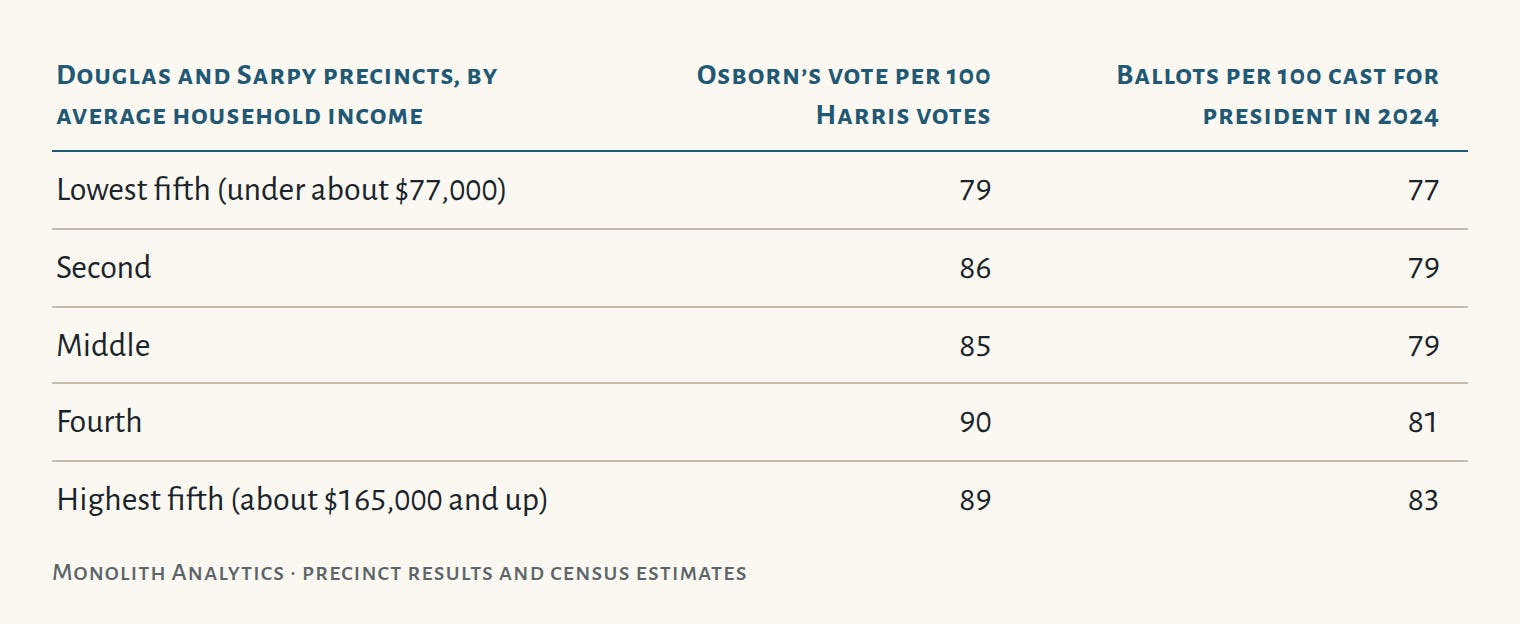
The poorest fifth of Omaha’s precincts cast 20% of Omaha’s Harris vote and accounted for 29% of its shortfall. Outside Omaha, the poorest fifth of precincts held 89 per 100, ten points better than Omaha’s. The precinct numbers are consistent with Harris’s voters staying home rather than switching to the Republican; the vote history will say for sure.
I’ll keep the size of this in proportion. If Omaha’s poorest fifth had voted at the rate of its richest, that’s about 3,900 more votes for Osborn. That’s a real number, and a sign of where organizing would have paid most, but it isn’t the race. The rest of the gap was spread across the whole city.
That’s not a judgment on them. Low-income neighborhoods vote less in midterms nearly everywhere, and the reasons are mostly material, not a matter of caring less: shift work, moving more often, less spare time, and fewer campaigns bothering to ask. The question is whether anything pushed against that, and two facts say it can be done here:
Nebraska used to. In 2018, Nebraska’s Democratic counties out-voted the rest of the state by four and a half points relative to 2016, in line with Kansas and Iowa. In 2026 the gap was one point, while Kansas and Iowa were back near six.
The cities once kept their new voters. Of the people in Omaha and Lincoln who first voted in 2016, 57% came back for the 2018 midterm, against 49% in the rest of the state. That edge was gone by 2022.
And this year, in the Nebraska precincts where Hispanic residents are most concentrated (the precincts holding a quarter of the state’s Hispanic population, South Omaha’s among them), the share of adult citizens voting rose from 26% in 2022 to 37%, the biggest rise of any group of precincts in the state. These neighborhoods vote when there’s a reason and a push.
Whose job it was
In 2024, both presidential campaigns spent the fall in these same neighborhoods, because Omaha’s electoral vote was in play. That ground war is a large part of why 2024’s turnout there was high, and it was never coming back in 2026.
Something had to replace it. In most Trump states this year, Democratic counties’ turnout rose where a Democrat was on the Senate ballot, a pattern my earlier post found across 13 states. It’s a pattern, not proof that the nominee caused it, but it’s the pattern there is. In Nebraska there was no Democratic Senate nominee, and that was a choice. The primary winner, Cindy Burbank, withdrew in July, and the state party’s central committee voted not to name a replacement; in September the Nebraska Supreme Court ruled the party was free to leave the slot empty. An independent running for Republican crossover votes has good reasons to keep some distance from that kind of operation. The state party, which might have filled the gap, had eleven people on payroll this fall, by its federal account’s monthly reports to the FEC. Volunteer, union and in-house door work doesn’t show up in filings, so I can’t rule out more organizing than the reports show. But the results look like nobody brought Omaha’s presidential-year voters back at the scale it needed. As far as the filings show, it wasn’t anyone’s job.
It isn’t an argument about ideology, in either direction. I don’t think ideological shifts win elections, toward the center or away from it, and nothing in these numbers needs one to explain what happened. The precinct numbers point to Harris’s voters in Omaha staying home, not switching sides. The pattern in the other states sorted by whether a Democrat was on the ballot, and finding it never required knowing what any of those candidates ran on. It’s an argument that the city half of a working-class coalition doesn’t show up on its own in a midterm. It has to be organized, and in 2026 nobody organized it at that scale.
Who should do that organizing, a party nominee’s campaign, unions, community groups or an independent campaign’s own field operation, is a fair argument, and one for another post. In 2026, none of them did it at the scale the 2024 presidential campaigns had.
Where the race was lost
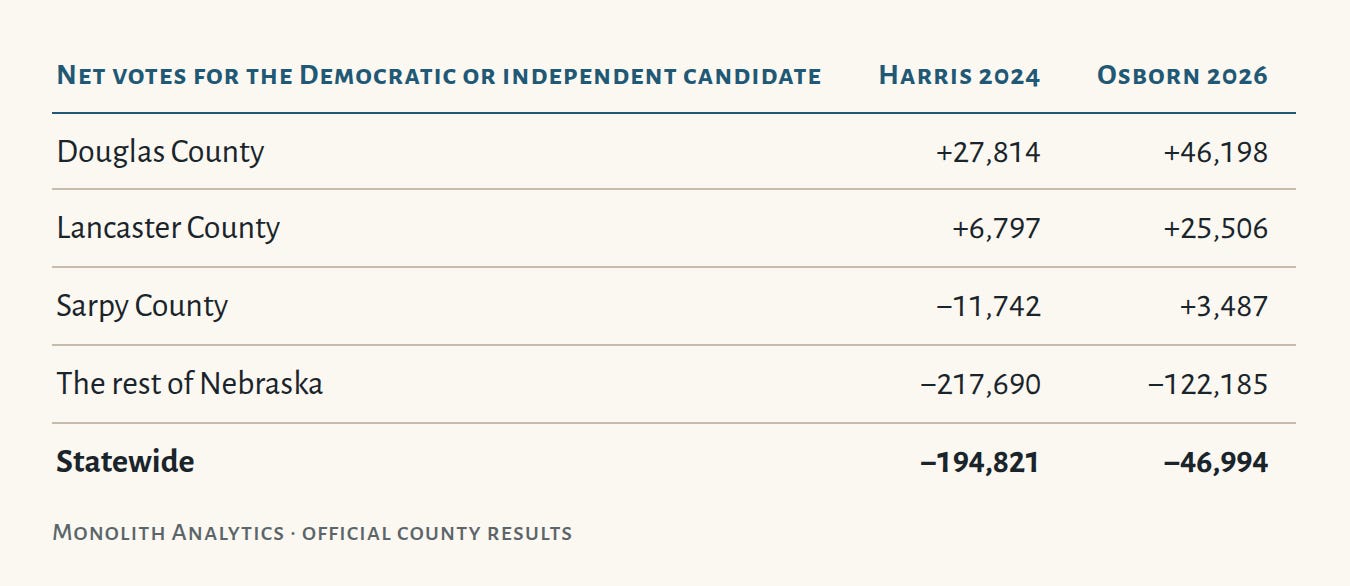
Ricketts’s margin comes from the rest of the state, and it always will. Osborn cut that deficit by about 95,000 votes against Harris’s, which is the rural strategy working. The campaign against Osborn likely did cost votes in the reddest places: Osborn ran 7 to 10 points behind 2024 in precincts Trump won with 70% or more, the same precincts where Osborn’s 2024 race had run furthest ahead of Harris. Both things are true. The rural vote slipped some, and the city vote was never organized at the scale it needed.
What would settle it
The state’s 2026 vote history, when it’s released, will show voter by voter who sat this one out. If the Omaha voters who skip midterms skipped this one, the shortfall was the city vote staying home. If they voted, something else happened, and I’ll say so.
Sources: Nebraska Secretary of State official canvasses, 2006–2024 (for 2006, the Official Report of the Board of State Canvassers, General Election, November 7, 2006, page 14, on the Secretary of State’s website at sos.nebraska.gov/sites/default/files/doc/2006%20General.pdf), and its county results for 2026 as of 7 November (later updates have added up to about 1,500 votes per candidate in Douglas and don’t change the picture); 2004 presidential county results from the MIT Election Data and Science Lab; county median household income from the Census Bureau’s American Community Survey, 2020–2024 five-year estimates; “most rural” is the lowest population per square mile of land, from the same survey and the Census Bureau’s county boundaries. The income table matches 2026 precinct results to 2024 results carried onto 2026 precinct lines and to American Community Survey estimates of average household income, for the 312 Omaha precincts with 100 or more Harris votes; it describes precincts, not individual voters. The South Carolina and Ohio figures and the county-income thirds are new here, computed from the same county results and census tables; the Hispanic-precinct group is from my unpublished 2026 election analysis. The other precinct, other-state, 2018 and new-voter figures, and the Senate-nominee turnout pattern, are from my earlier posts, “Nebraska got the wave but not its own voters” and “Why Nebraska’s Democratic base stayed home”. Each gives its sources. Corrected: an earlier version said four or five; that count missed six staff paid as shared administrative payroll.
First published on That's Not How This Works. Subscribe there to get each post by email.